To start off, for a complete monitoring and alerting setup in your Kubernetes cluster using Docker YAML files, you will need the following components for prerequisite setup:
- Prometheus: For monitoring and alerting.
- Alert manager: For handling alerts sent by Prometheus.
- kube-state-metrics: For generating metrics about the state of Kubernetes objects.
- Redis: Depending on your specific use case, Redis might be used as a storage or caching solution, although it is not always required for Prometheus and AlertManager setup.
We have been tasked with writing two alerting rules.
In order to set up monitoring:
- We will first edit prometheus-rules-config-map.yml:
nano prometheus-rules-config-map.yml- We will add this to the existing config (last row)
   redis_alerts.yml: |
    groups:
    - name: redis_alerts
      rules:
      - alert: RedisServerDown
        expr: redis_up{app="media-redis"} == 0
        for: 10m
        labels:
          severity: critical
        annotations:
          summary: Redis Server {{ $labels.instance }} is down!
      - alert: RedisServerGone
        expr:  absent(redis_up{app="media-redis"})
        for: 1m
        labels:
          severity: critical
        annotations:
          summary: No Redis servers are reporting!
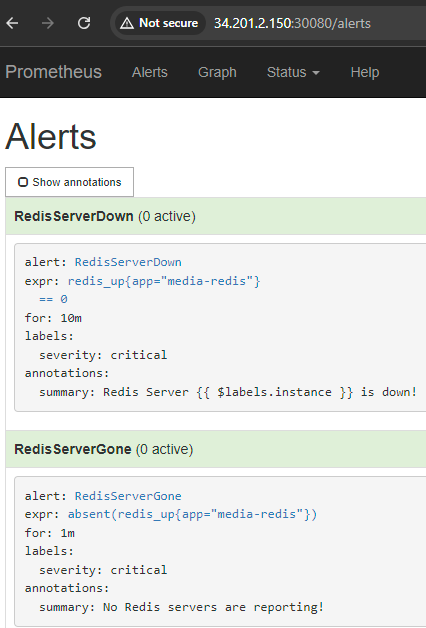
These two new rules will utilize the redis_up metric, and the condition to detect when the instance is down.
The first rule will fire an alert if any of the Redis pods are down for 10 minutes.
The second alert is RedisServerGone this will evaluate whether the instance is reporting or not and mark it as a critical service warning.
- We will apply the configurations.
kubectl apply -f prometheus-rules-config-map.yml - List the pods again to find the pod name of the Prometheus running.
kubectl get pods -n monitoring- Delete the Prometheus pod.
kubectl delete pods <POD_NAME> -n monitoring- The system will regenerate the Prometheus pod again on its own, we now need to access Prometheus through our browser using
Serverip:30080the default port it's set up to.

- Click on the Alerts link to verify that the two Redis alerts are showing green.
